Debug Solidity Transactions with Simbolik on BuildBear
Step-by-step guide to debug smart contract transactions using Simbolik’s debugger within BuildBear.
Introduction
Simbolik enables step-through debugging and variable inspection, allowing developers to:
- Debug up-to-date Solidity contracts with the latest EVM versions
- Explore transaction behavior directly in their Sandbox
- Enjoy a clean and intuitive developer experience directly from the browser
What You Will Learn
In this tutorial, you'll learn how to:
- Set up a Foundry-based smart contract project with BuildBear
- Deploy and verify contracts using Sourcify on BuildBear
- Use the Simbolik Plugin on BuildBear to debug your Solidity transactions in a cloud-hosted VS Code environment
1. Clone the Project
2. Set Up Your BuildBear Sandbox
Once the Sandbox is created, populate the .env and Makefile with your BuildBear Sandbox RPC and other required details.
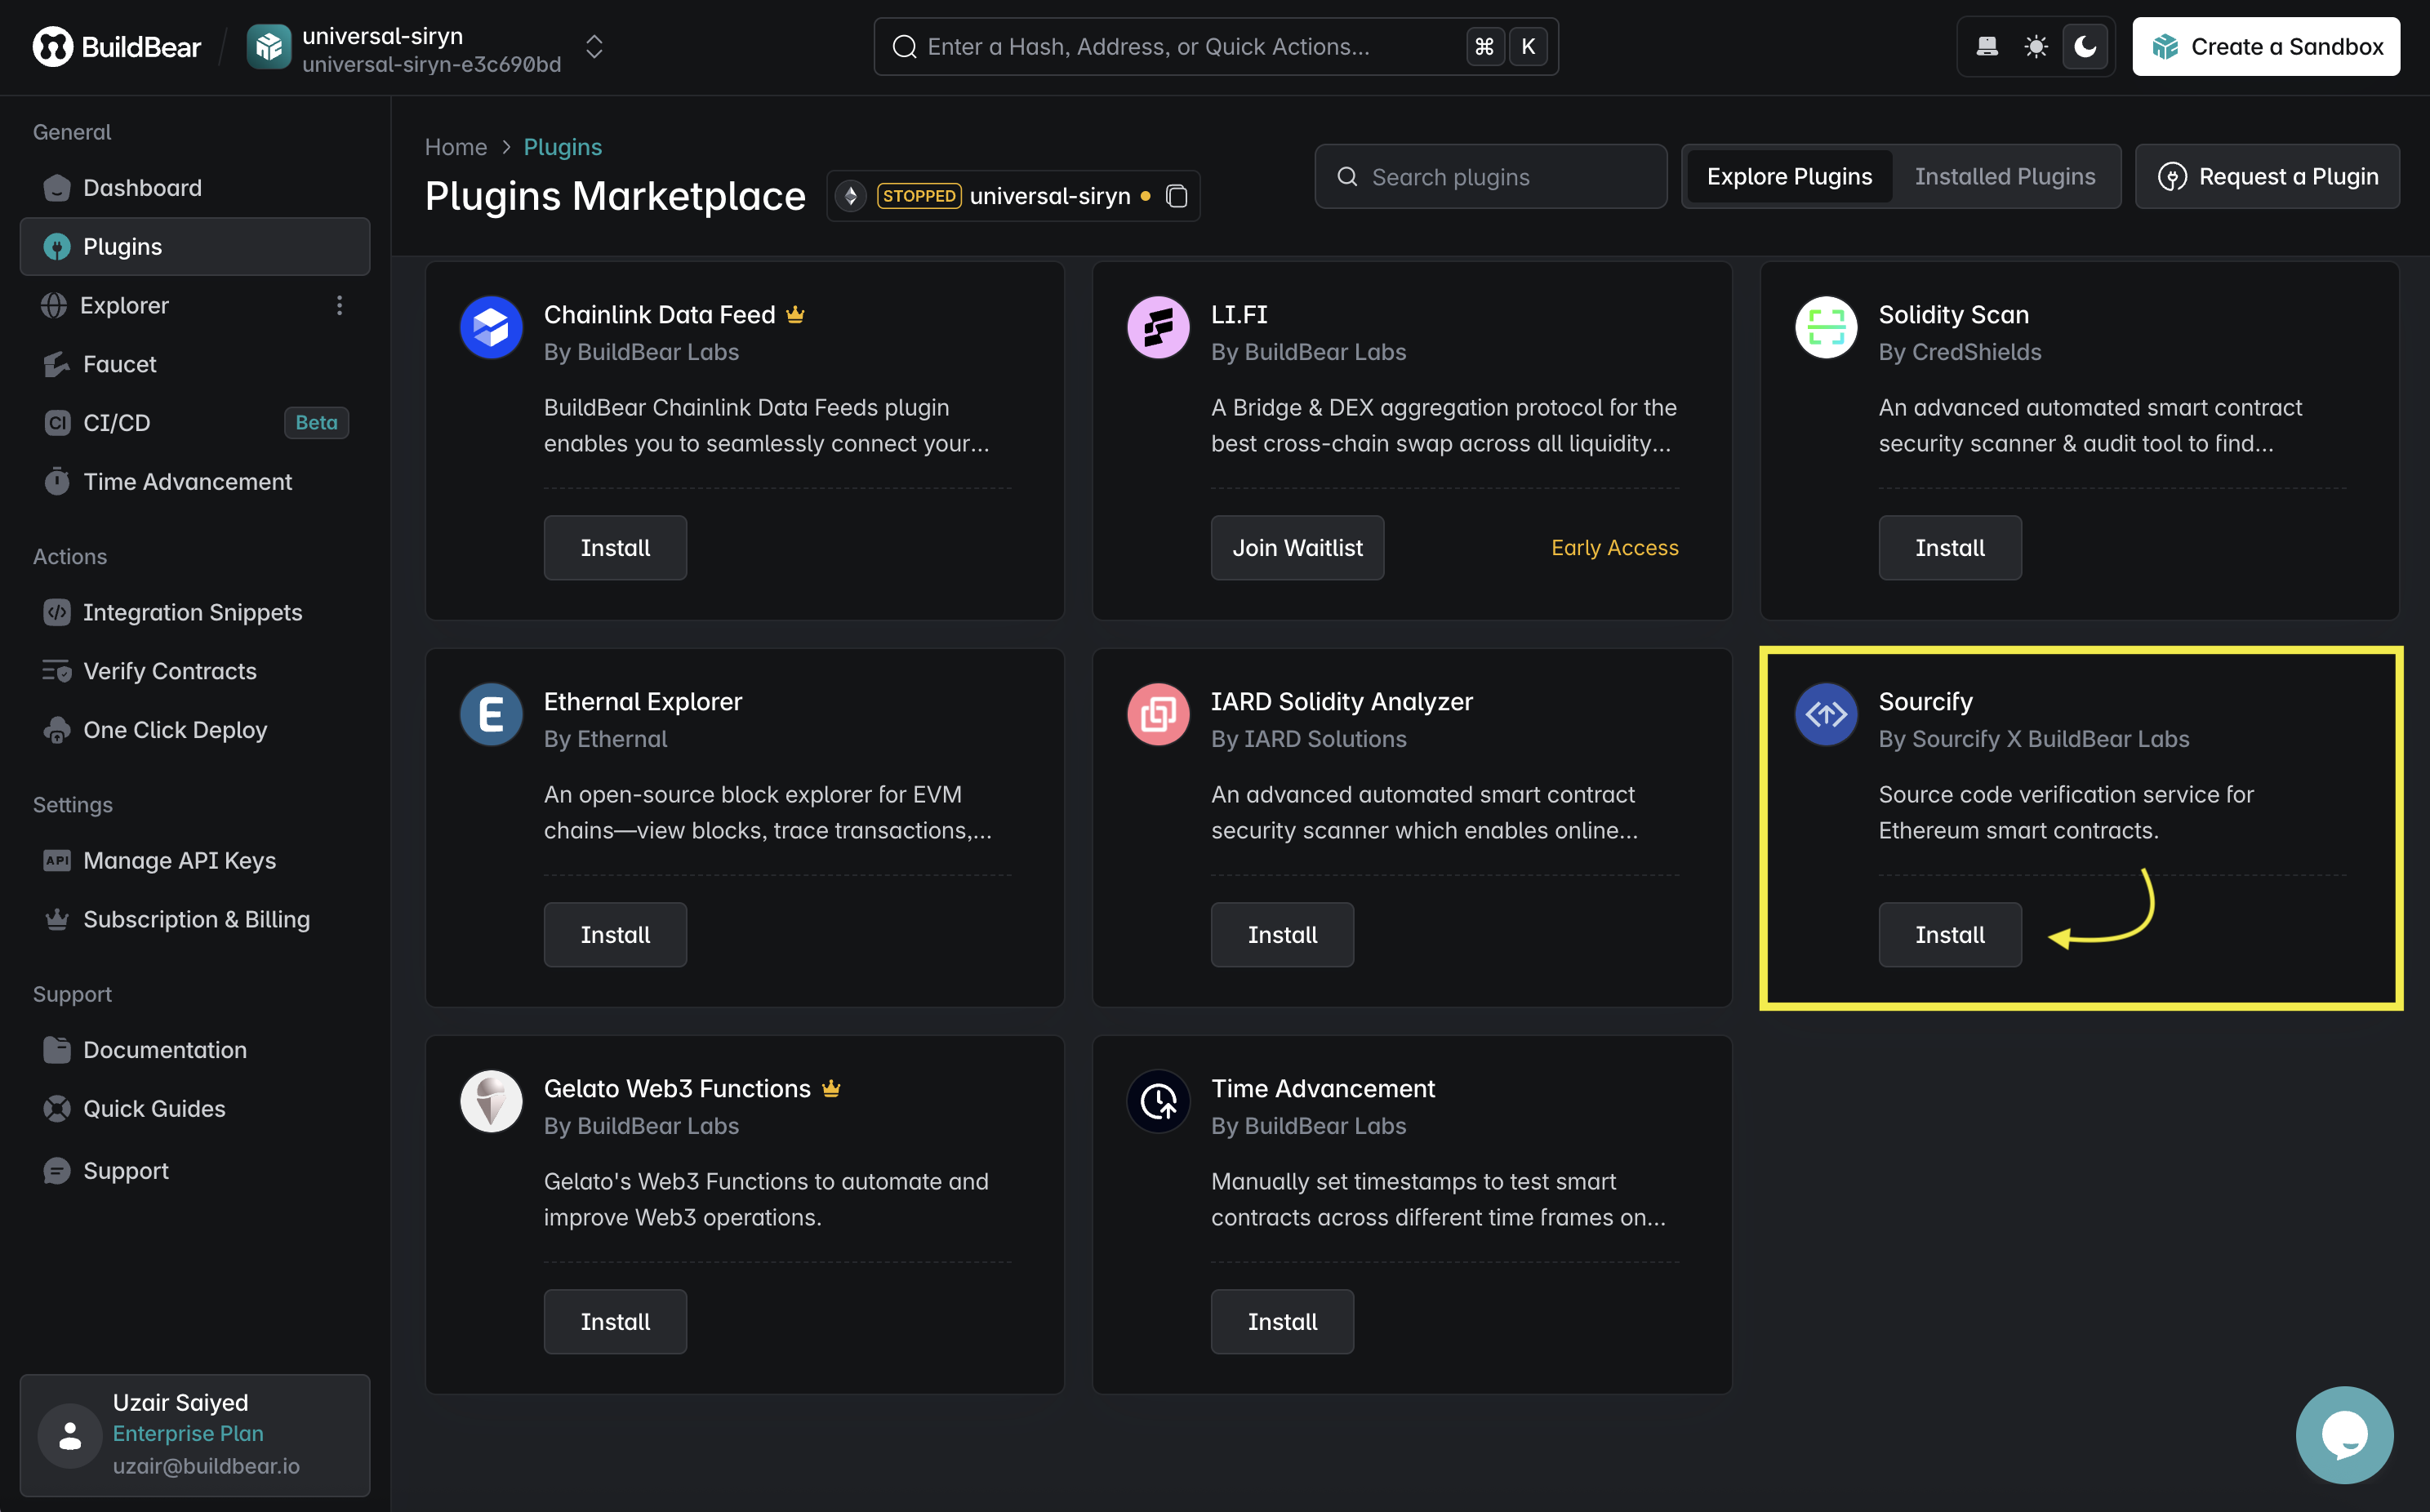
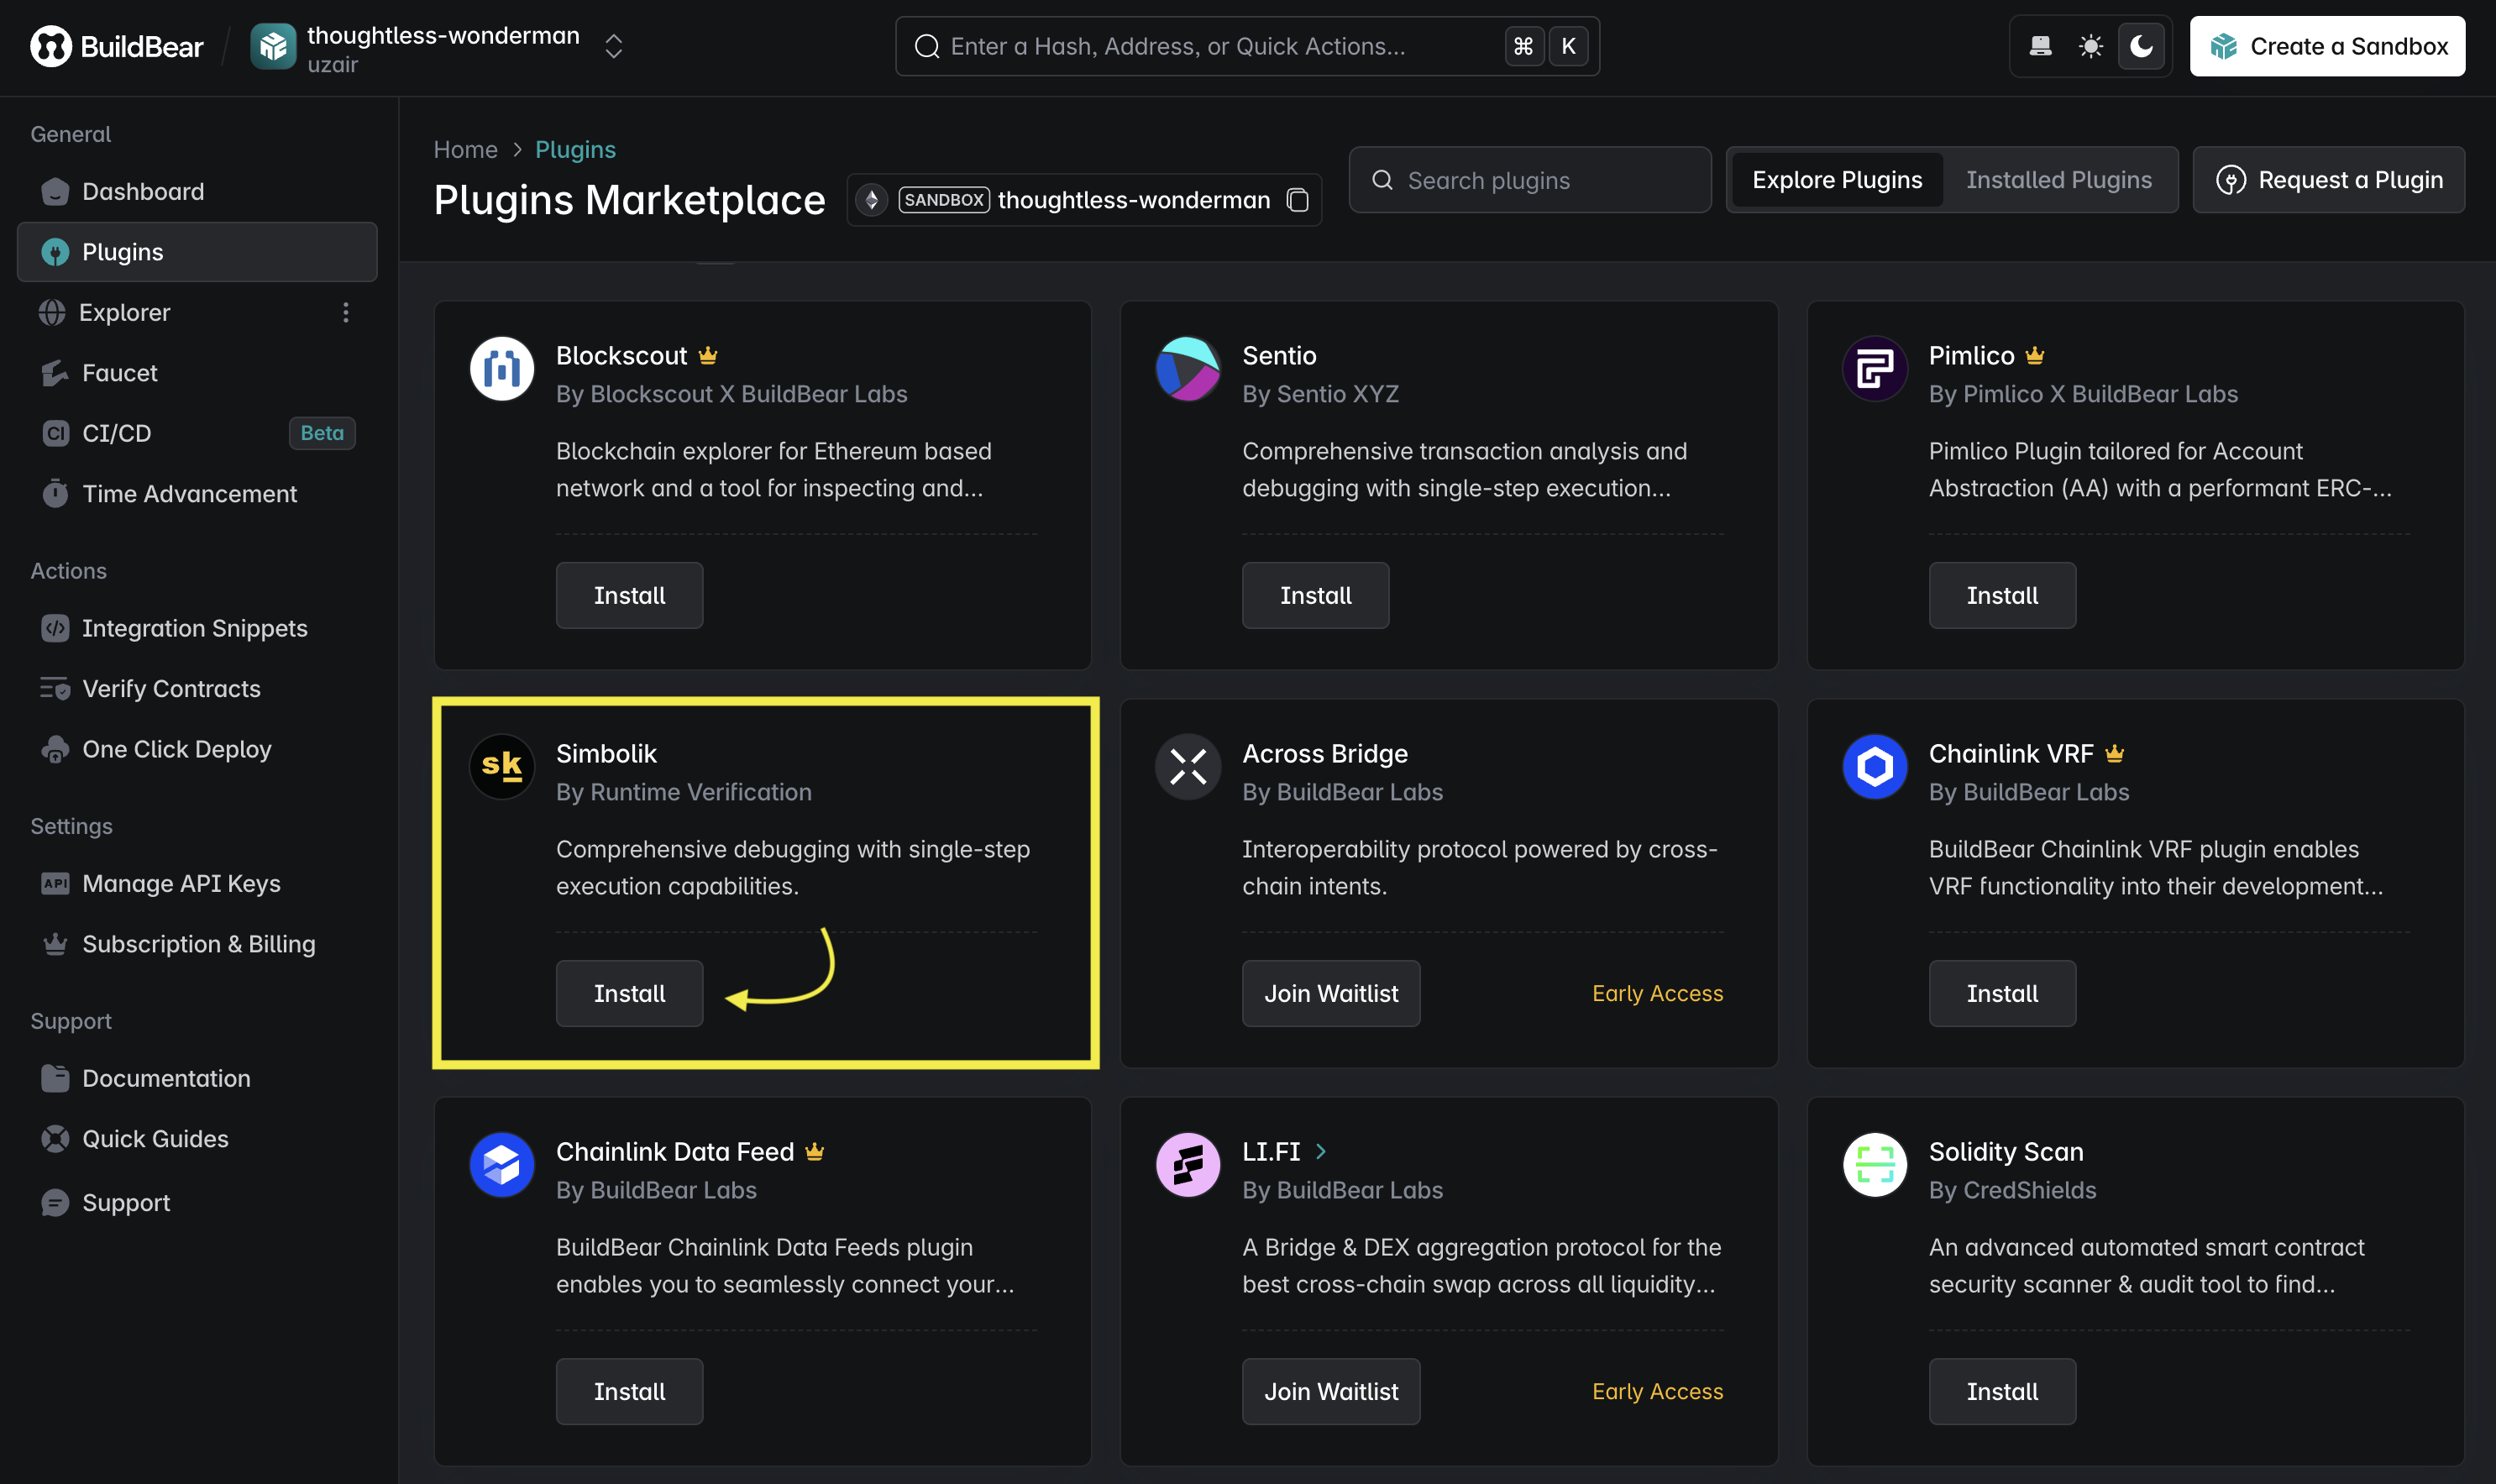
3. Install the Sourcify & Simbolik Plugins
Simbolik relies on Sourcify-verified source code to debug contracts. It currently works best for unoptimized contracts as there can be limited debugging information and inconsistencies, with optimized builds. Support for optimized contracts is improving with Solidity’s debugging tooling.
Before running any transactions:
- Go to your Sandbox's Plugins tab
- Look for Sourcify & Simbolik
- Click Install Plugin
4. Deploy and Verify Contracts
Inside scripts/HelperConfig.s.sol, you will need to update your BURNER_WALLET based on the mnemonic or private-key used.
This wallet is used for deploying a smart account and sending userOps.
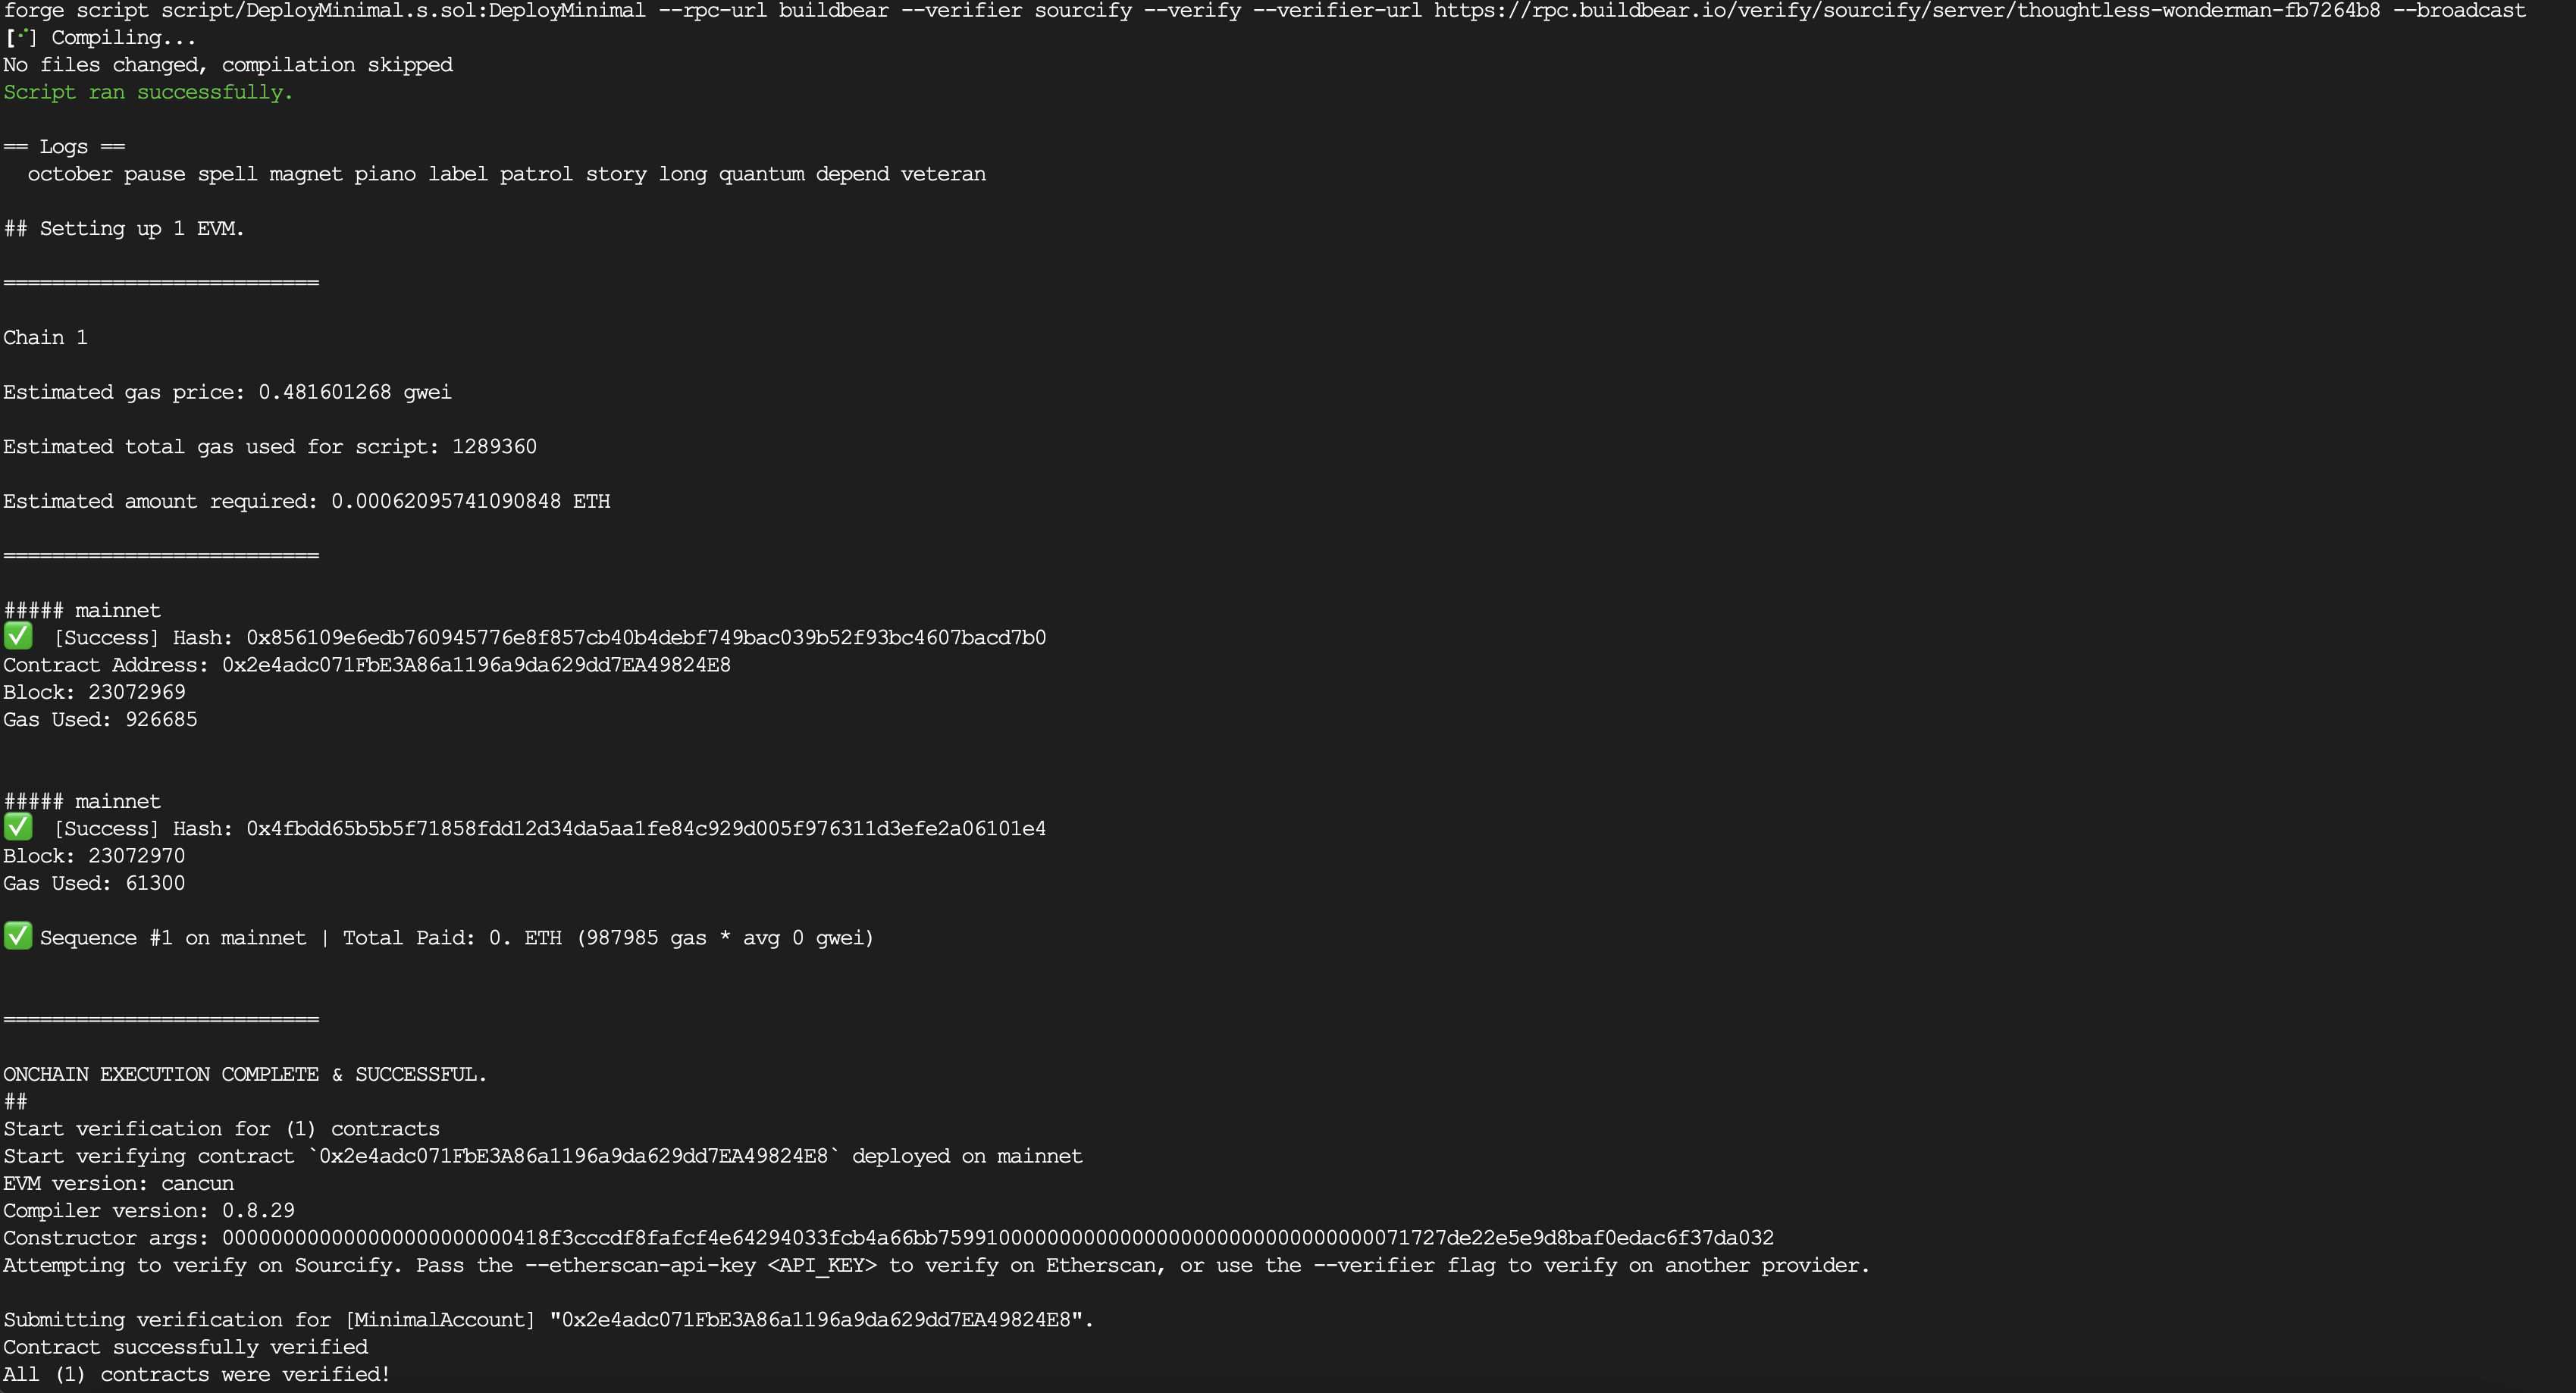
You can now deploy the contracts and submit the source code for verification using the make command:
This command does two things:
- Deploys the contracts to your Sandbox
- Automatically verifies them on Sourcify using the plugin
Once complete, you'll be able to debug these contracts with Simbolik.
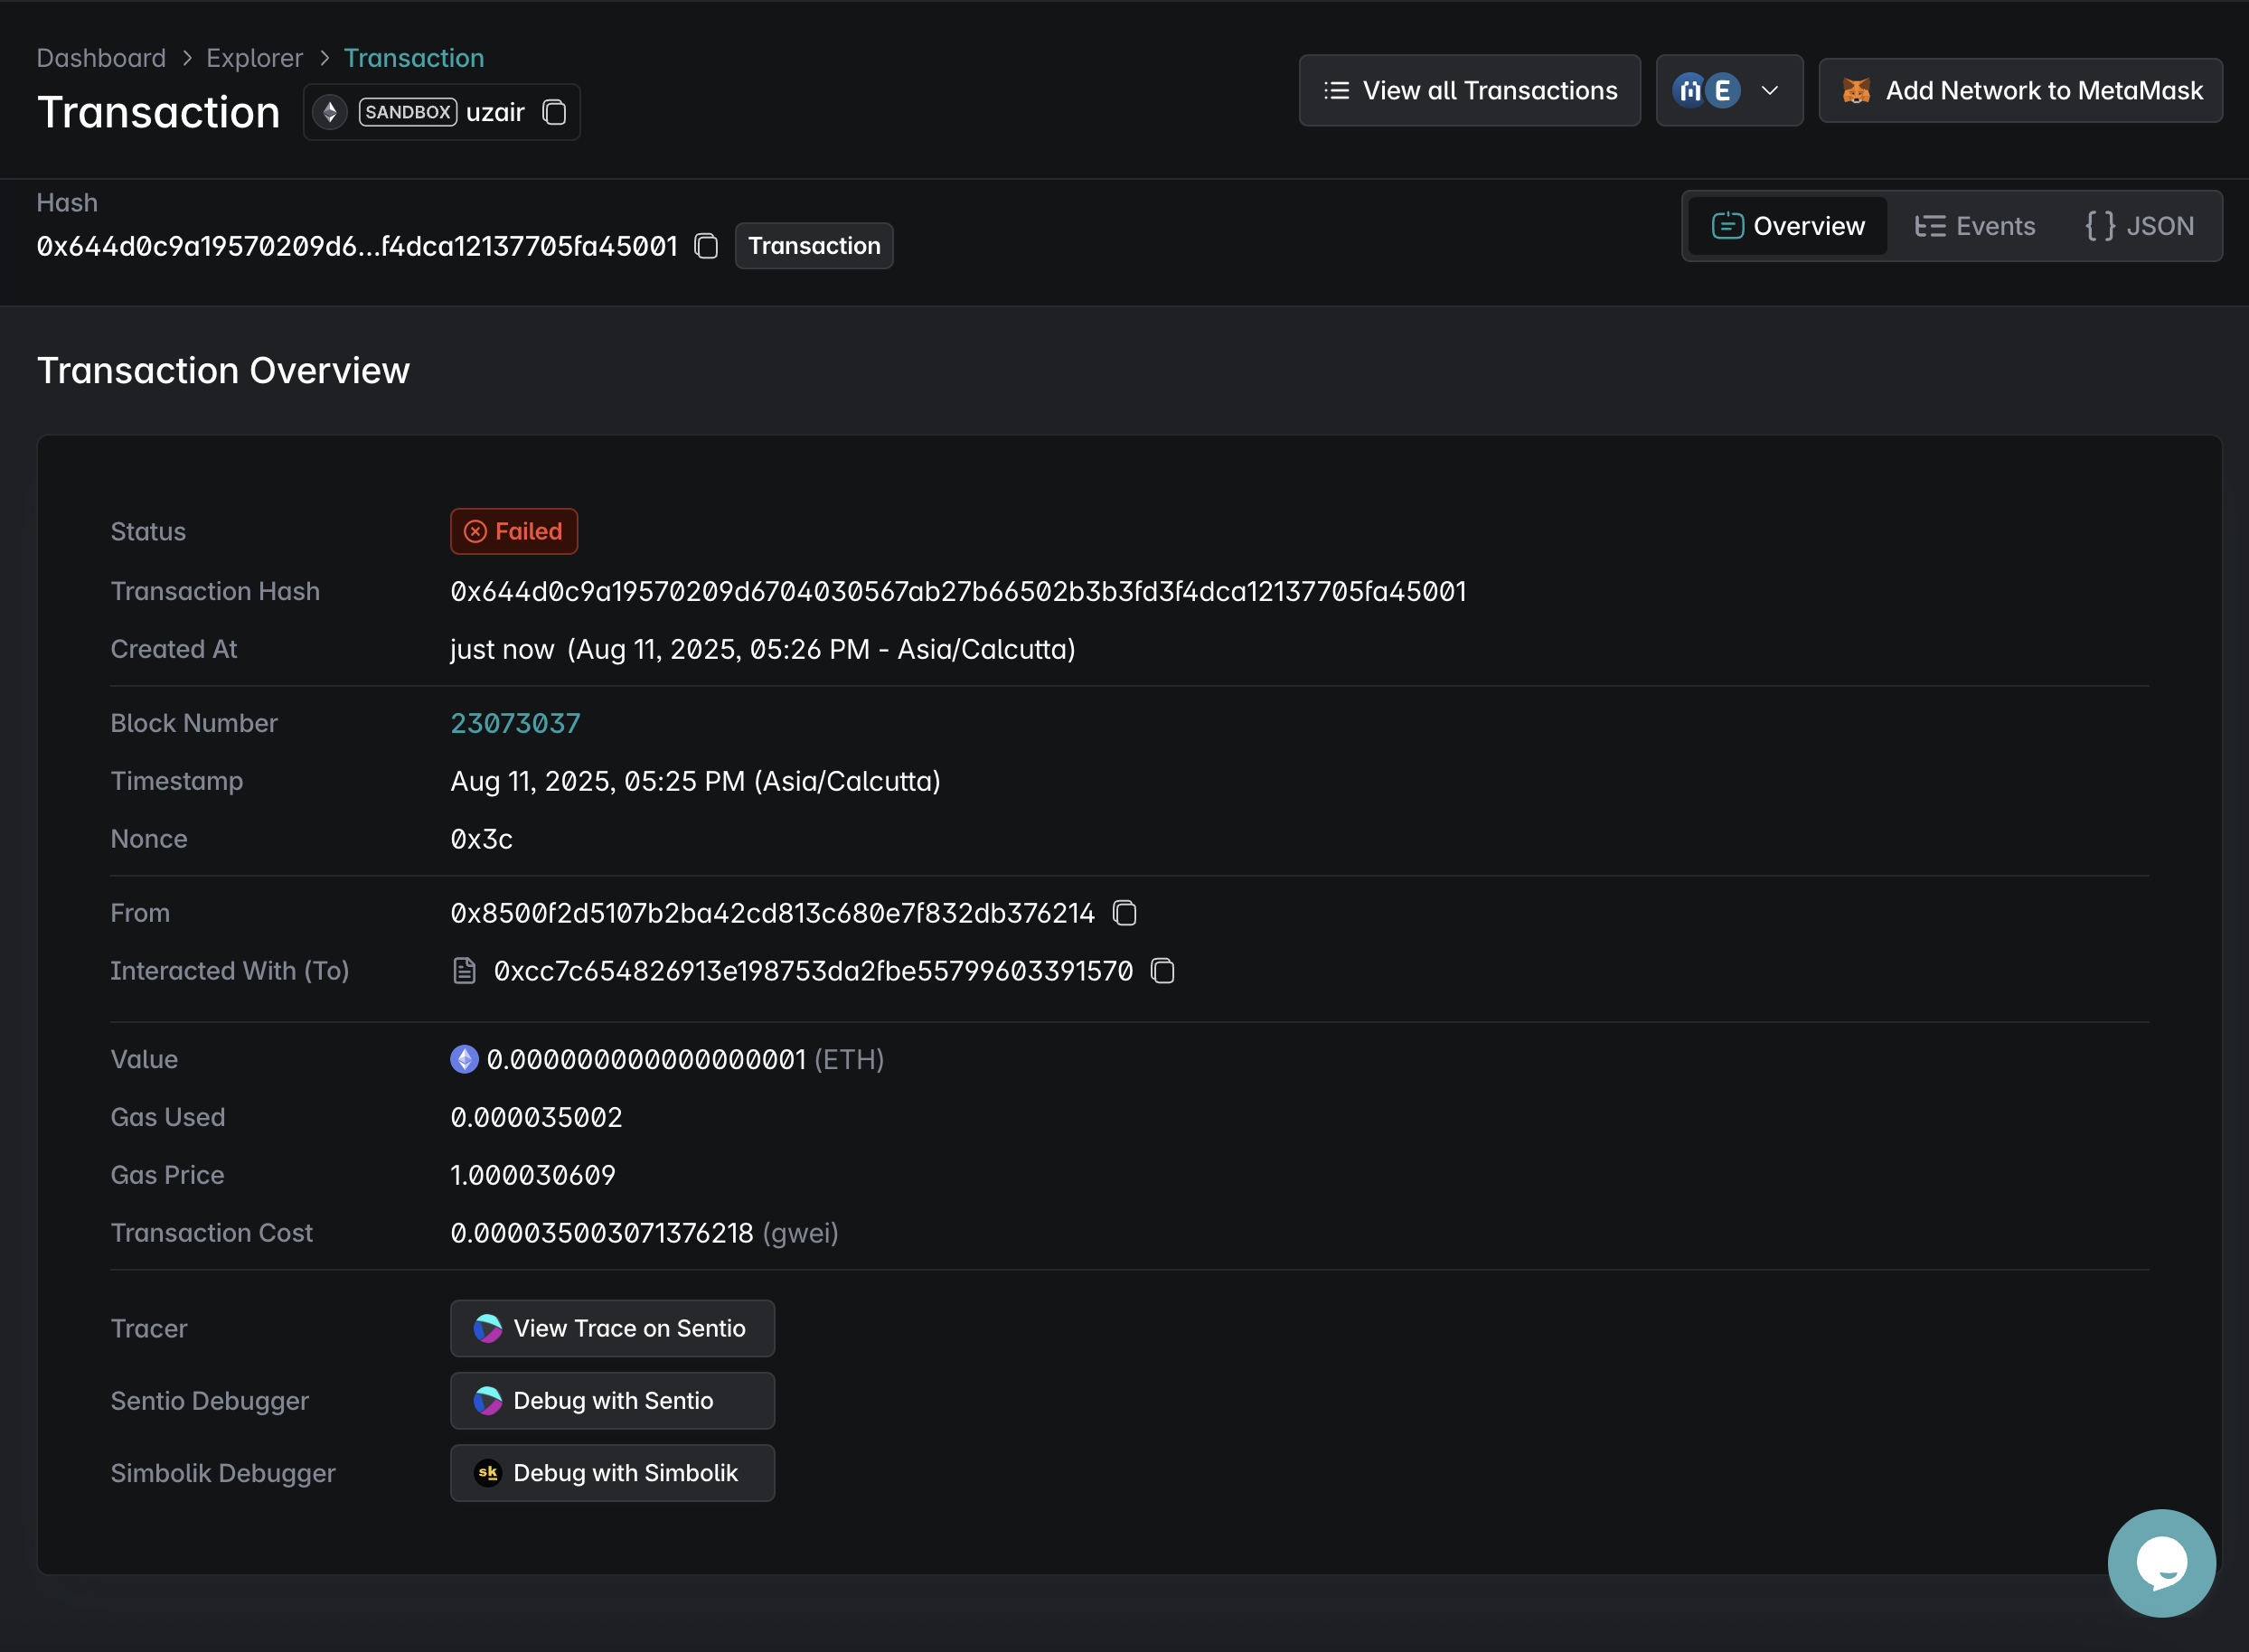
5. View and Debug the Transaction
Navigate to your Sandbox's Explorer tab:
- Find your transaction in the list (e.g., deployment or test interaction)
- Click on the Tx Hash to open transaction details, where you will now see a “Debug with Simbolik” button
Clicking this will:
- Open a VS Code Cloud IDE
- Launch Simbolik’s debugger view for that transaction
6. Use the Simbolik Debugger
The Simbolik debugger allows you to:
- Step through each instruction of the transaction
- Inspect variables and stack values
- Choose breakpoints for debugging like contract calls, events, jumps, etc.
This helps uncover edge cases that may not be hit during normal test execution.
7. Capturing a Failing Transaction with Hardhat
In addition to debugging a successful ERC-4337 transaction, you can also use Simbolik to inspect and understand a transaction that reverts.
We’ll use a Hardhat project to deploy two contracts (Sender and Receiver) where a transfer call will fail due to the 2300-gas stipend limit.
We use hardhat to prevent foundry from catching the reverts during the transaction simulation phase.
7.1 Project Setup
Install Hardhat and required packages:
.env file:
7.2 Hardhat Config Setup
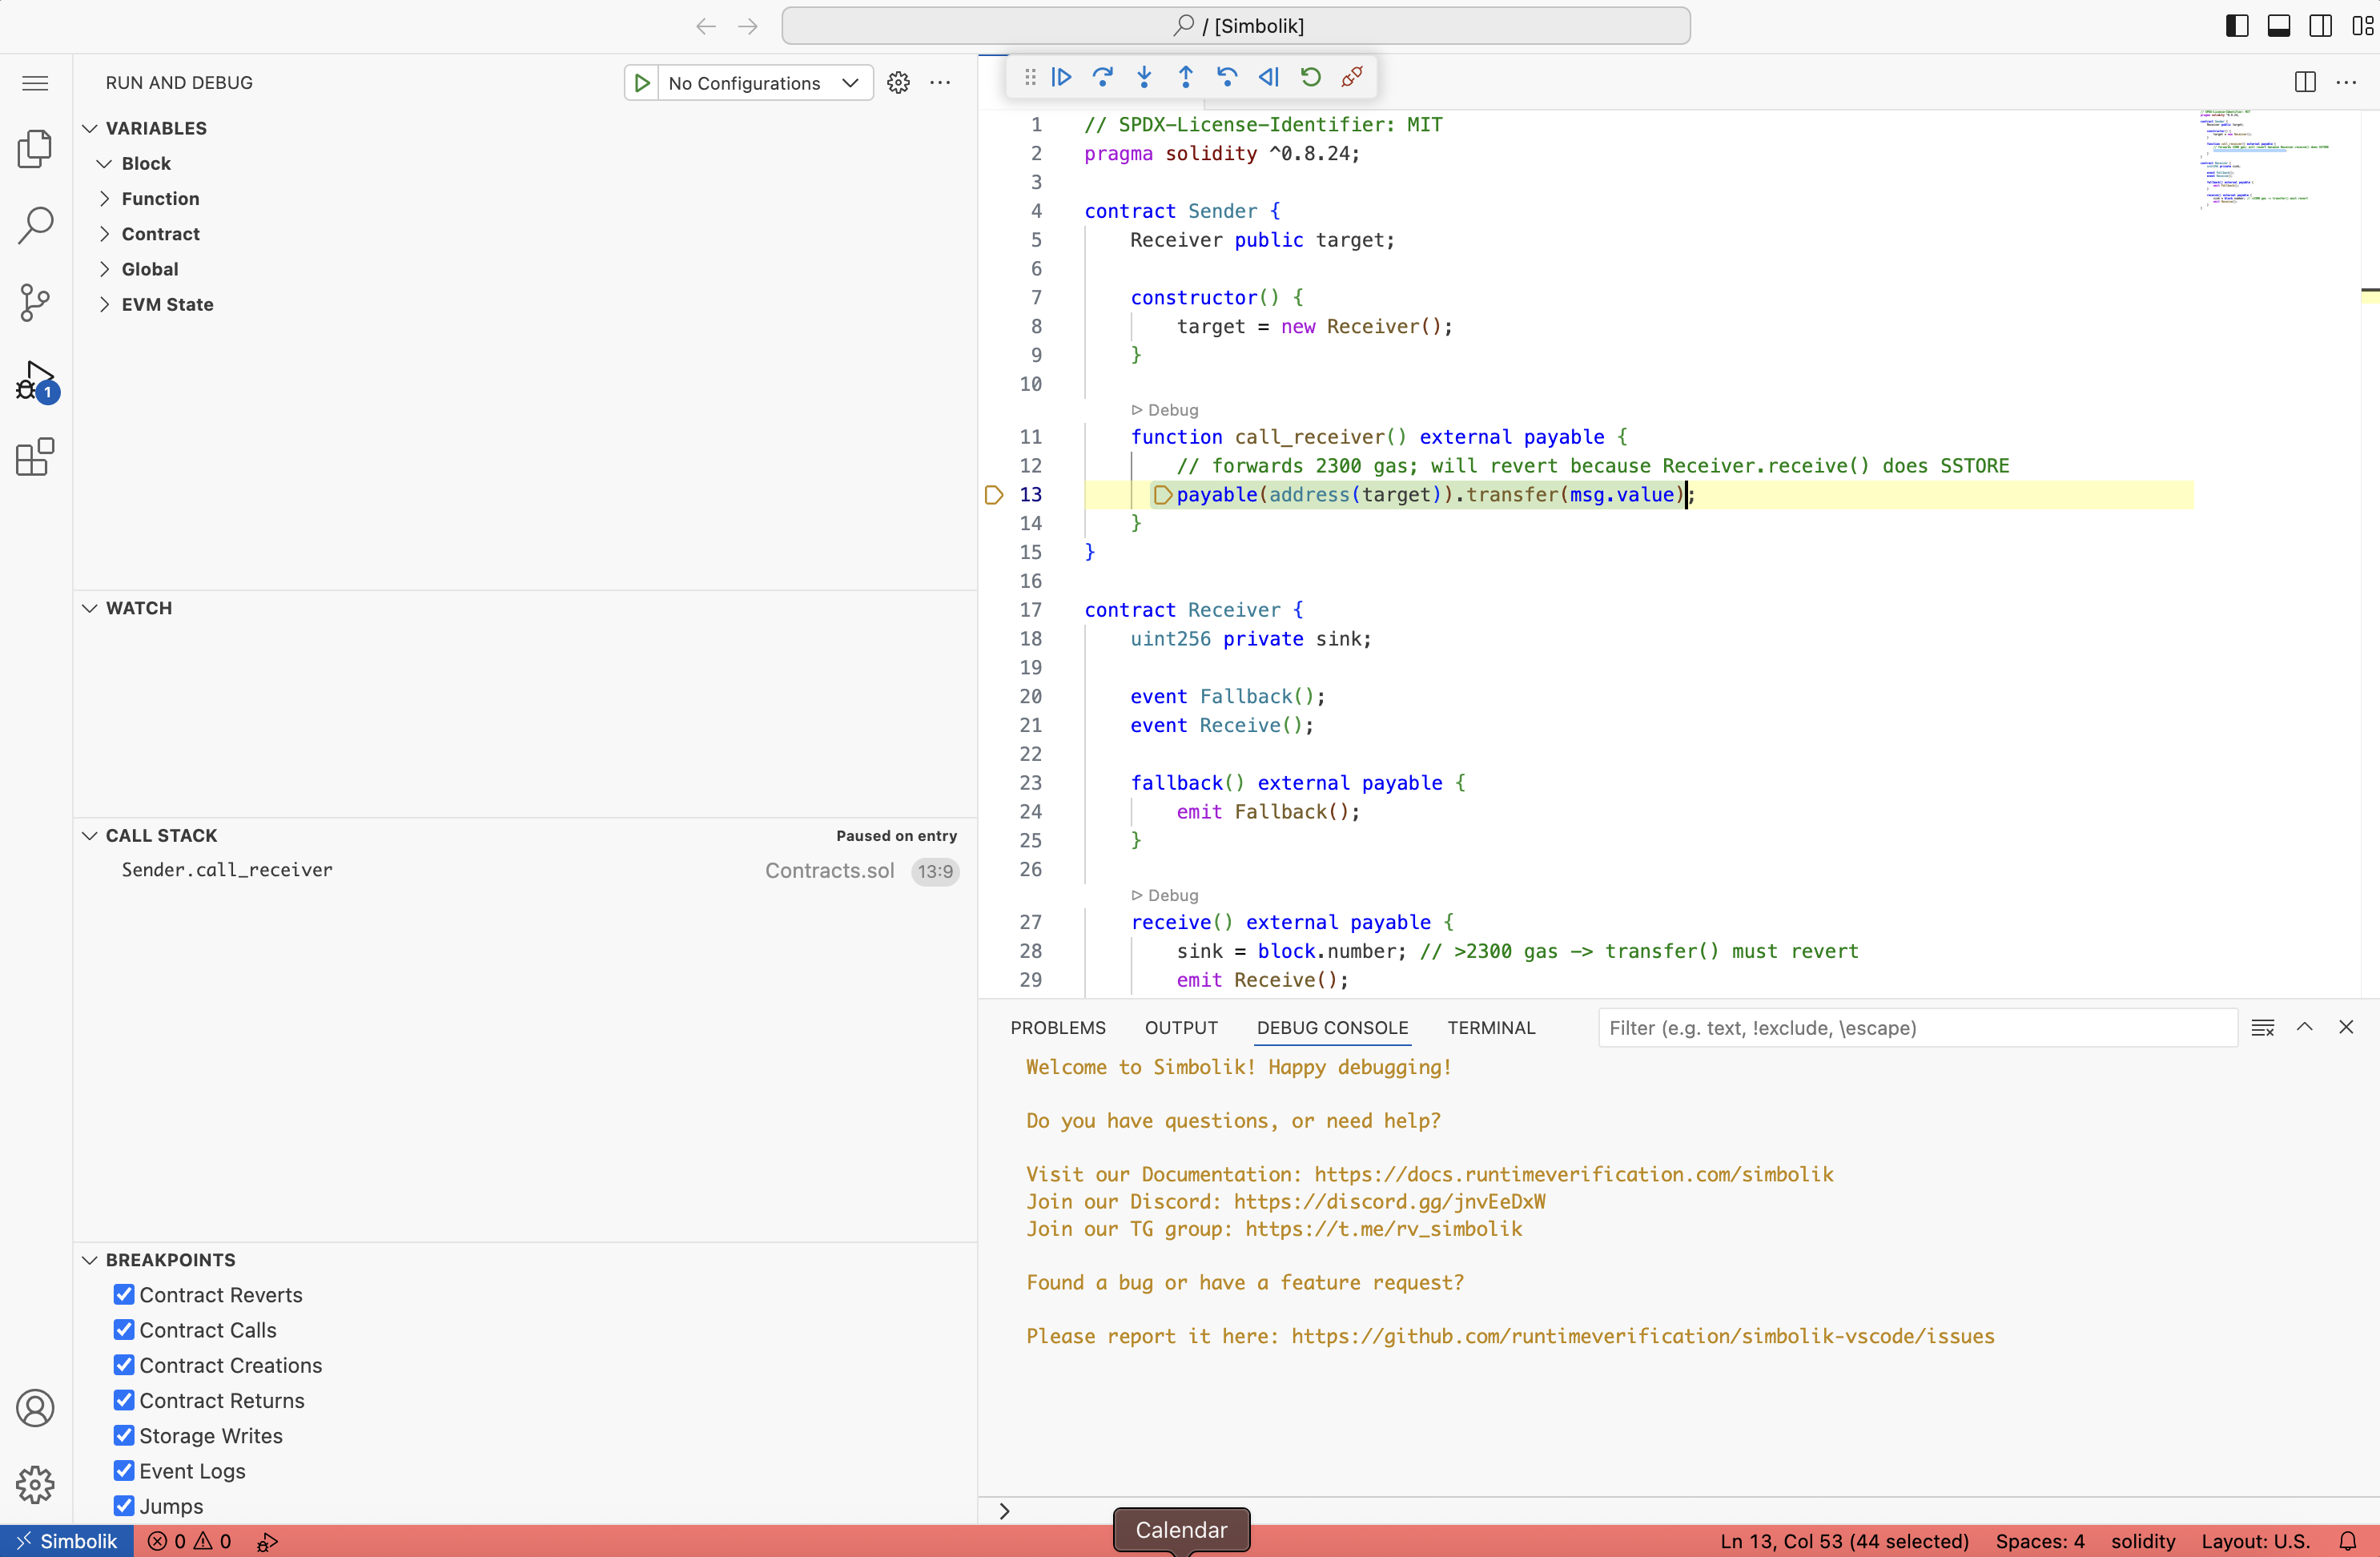
7.3 Contracts (contracts/Contracts.sol)
7.4 Hardhat Script: Deployment + Verification + Failing Tx
Execute it using Hardhat:
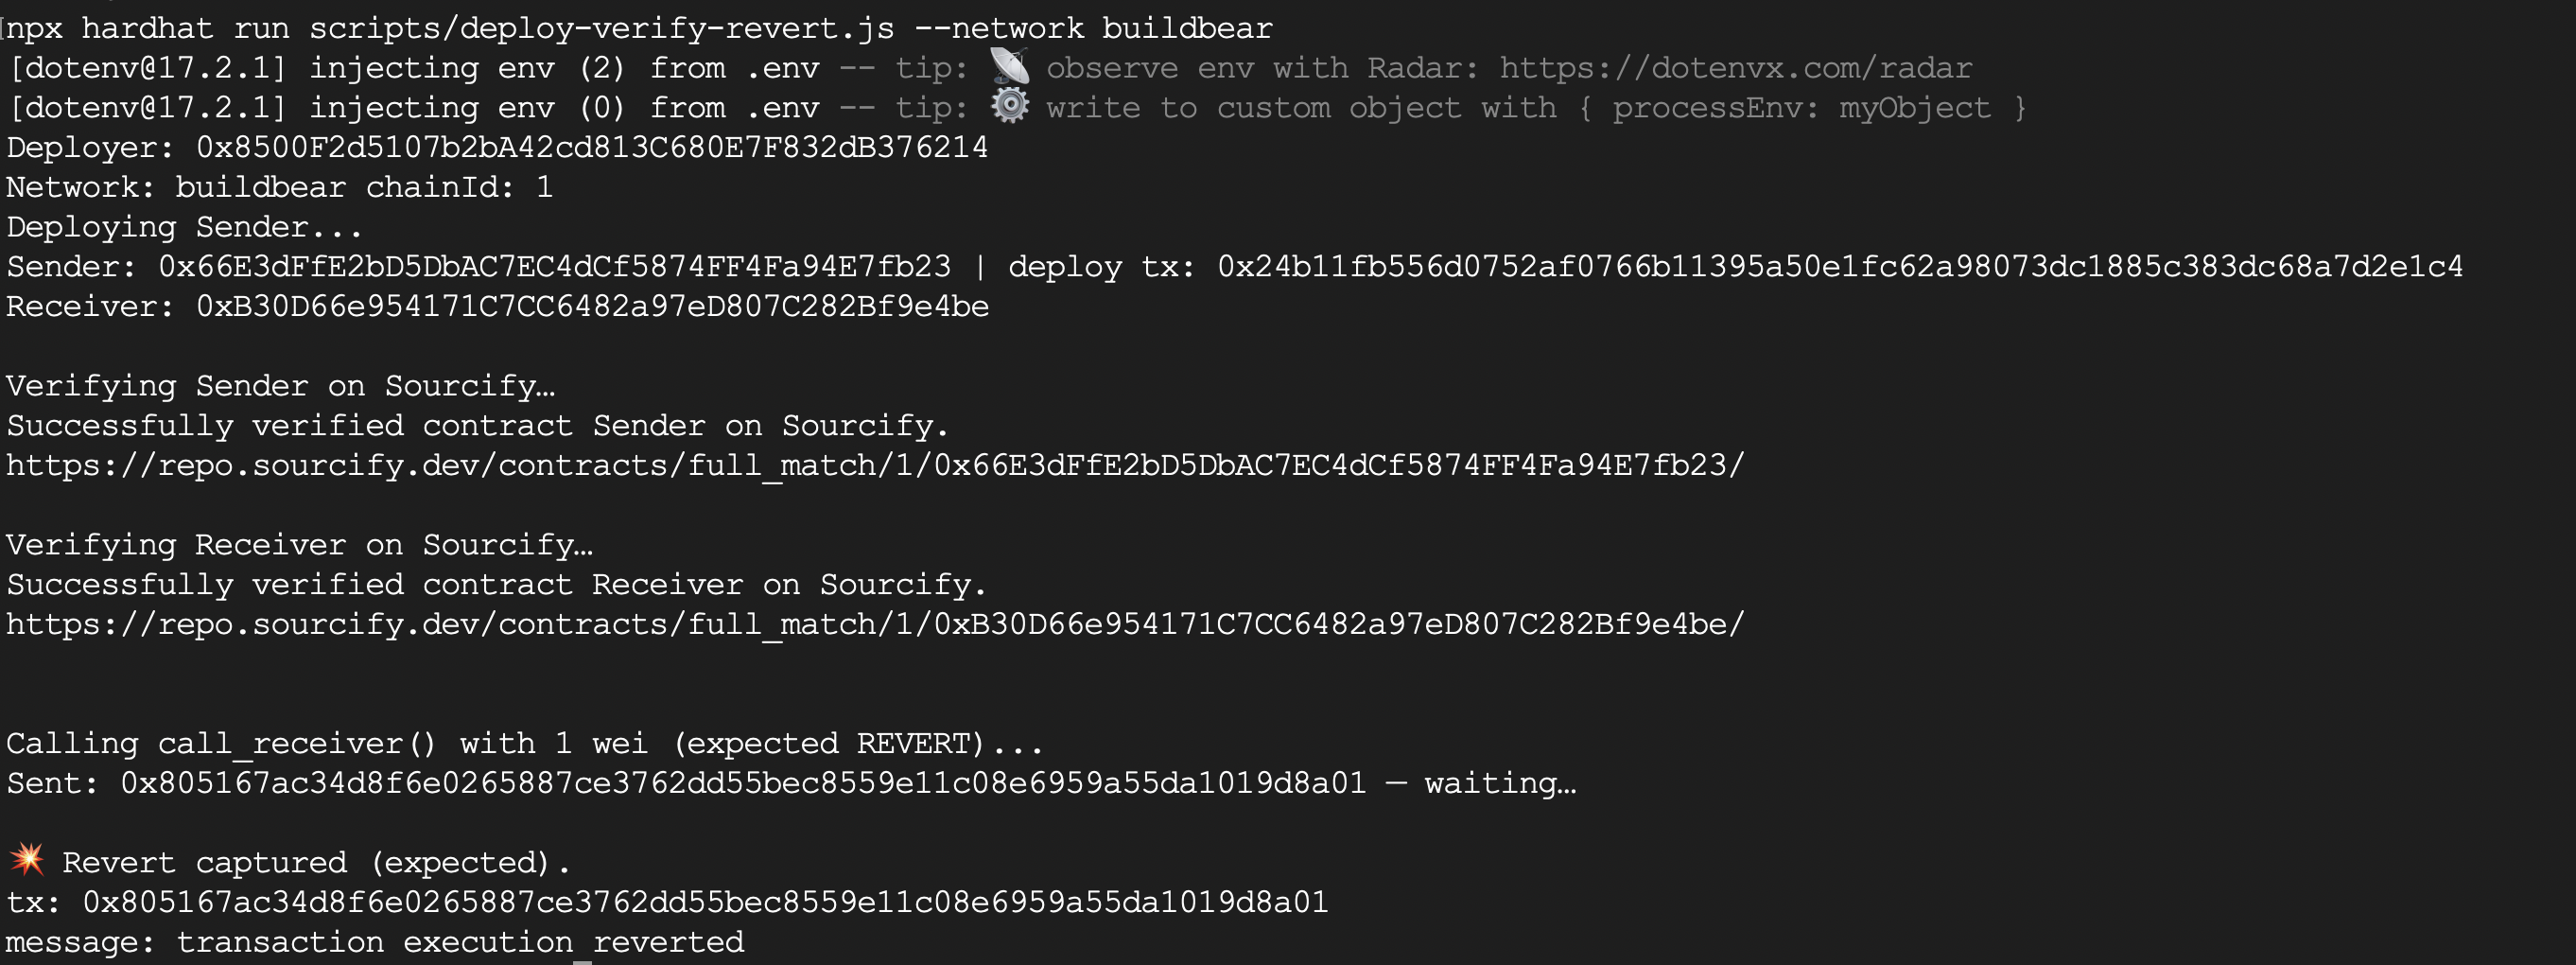
Both can be opened in Simbolik from the BuildBear Explorer.
We can open this in Simbolik Debugger to inspect the tx and the reason for the revert.
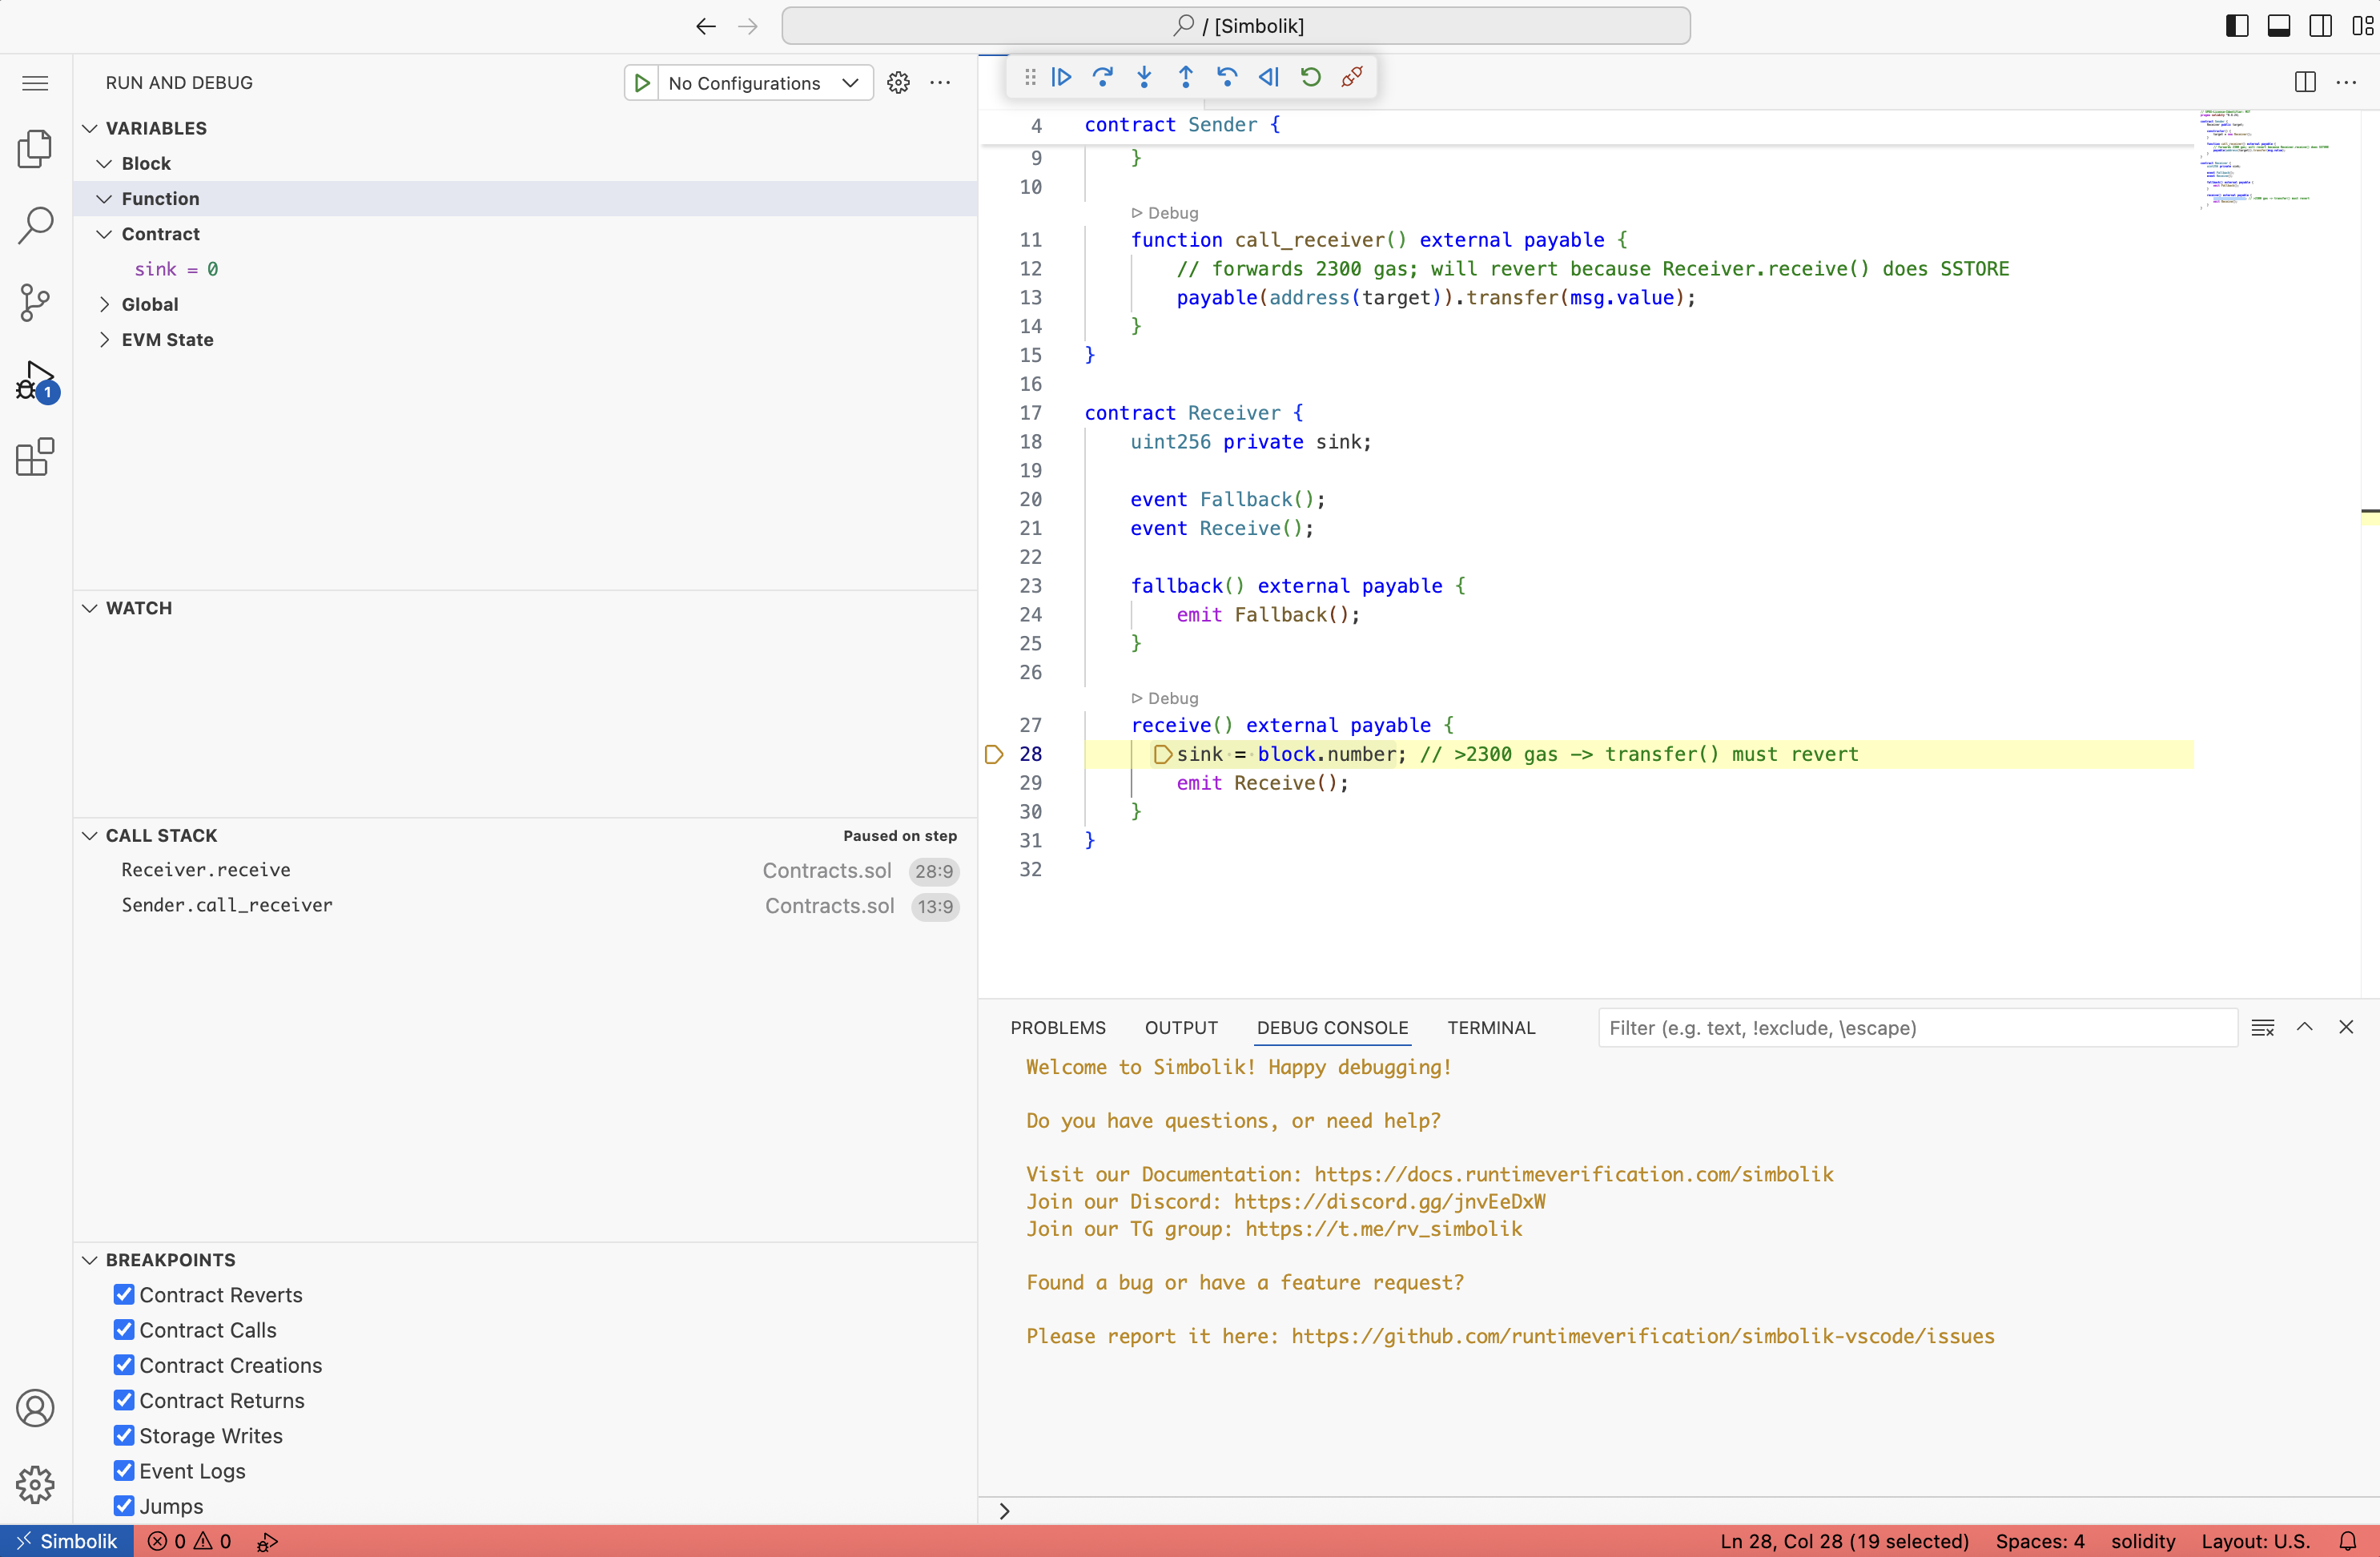
The transaction debug halts at the line as shown in the image below, because the sink variable is being set, which requires more than 2300 gas:
We can do a debug_traceTransaction on the Tx-Hash to see the trace of the transaction and the reason for the revert.
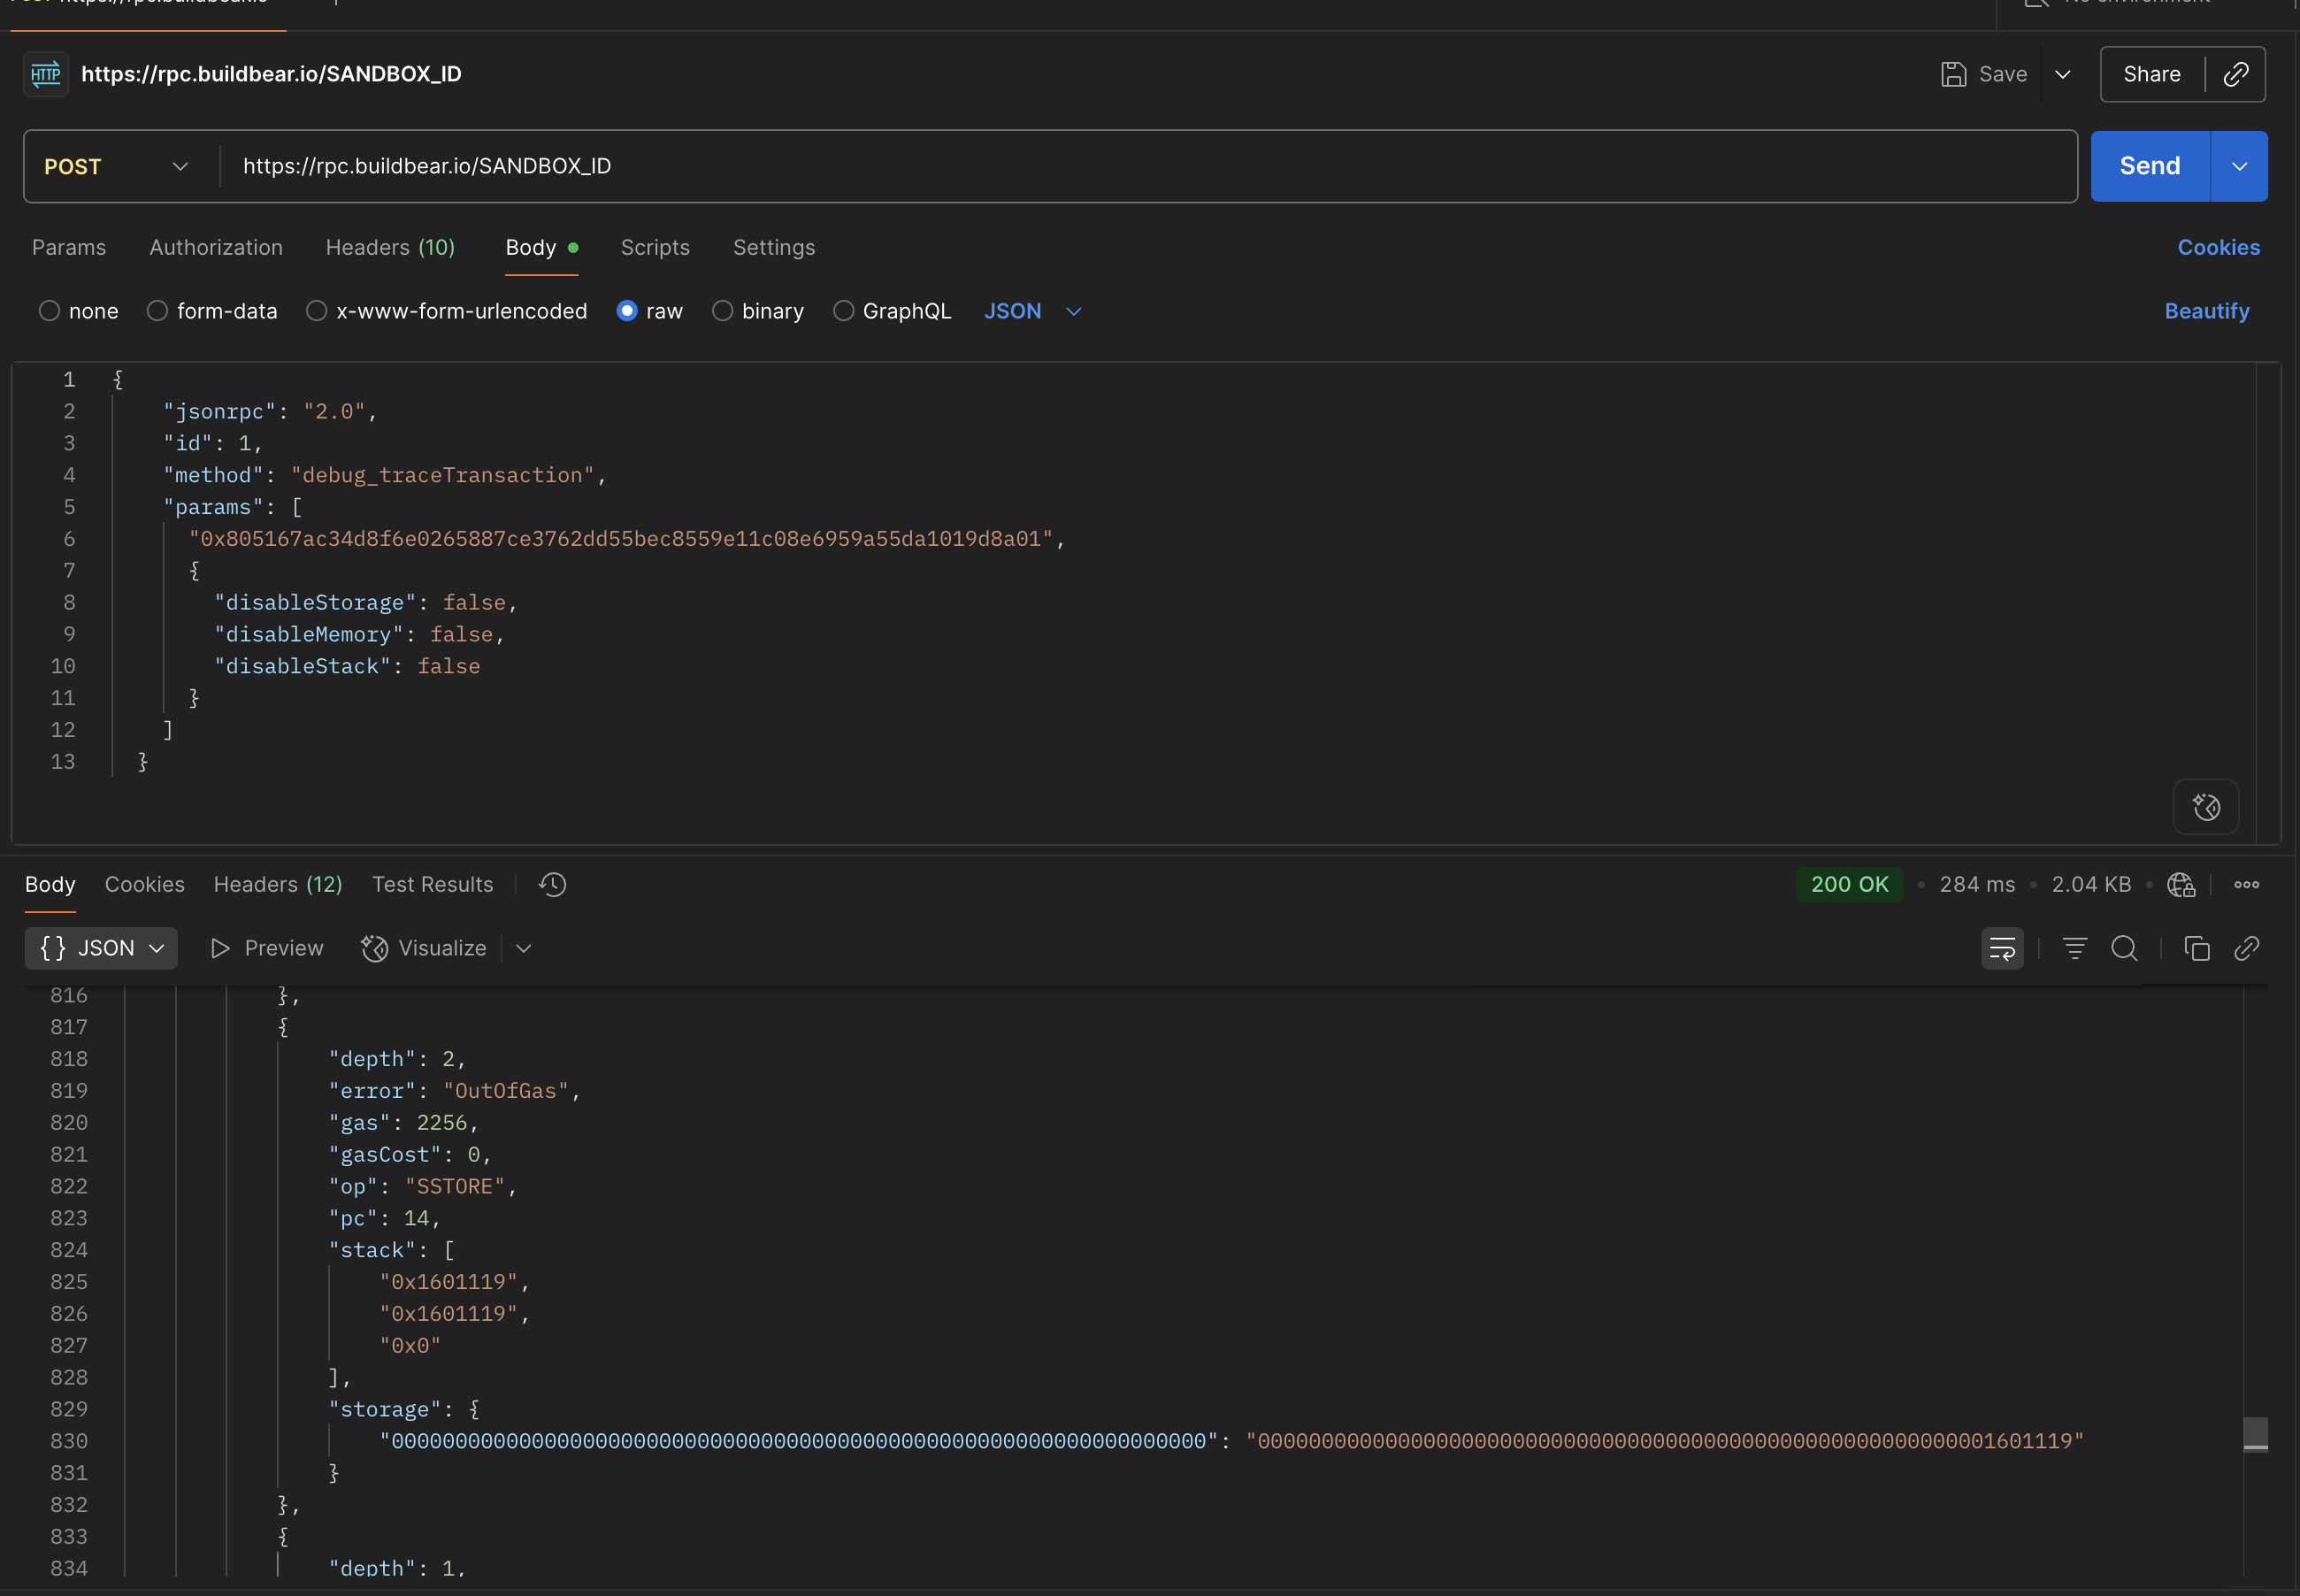
Alternatively you can also use cURL to get the trace of the transaction:
Conclusion
You've now set up Simbolik on a BuildBear Sandbox and used it to debug Solidity transactions.
Simbolik helps you breakdown complex transactions that are difficult to understand and also allows you to explore edge cases that may cause reverts or transaction failures during transaction execution.
For questions or help, reach out to [email protected] or visit our Plugin Marketplace to explore more debugging tools.
Shadow Fork 101: A Comprehensive Guide
Learn how shadow forks provide developers with a safe testing environment by replicating Mainnet state and enabling real-world simulations.
A Comprehensive Guide to SmartContractX Features
Learn how to use SmartContractX, a web3 tool for contract deployment and interaction.